[box]#BeatTheBuzz: The world’s greatest agencies and most exciting brands gather in London, on April 14th. Book your place now![/box]
It’s hard to believe, but in only ten years social media have become major parts of our lives. They have brought massive changes to how we communicate, how we work, how we vote, but also to how we think about geographical distance. Other than just their growth, what other notable trends can we identify from 10 years of social media use and their state today?
Also Read: Umm… Do I Still Need A Facebook Page?
As every year, the Pew Research Centre conducts it’s social media study and releases its findings. Only this year, we get a ten-year history to look back upon. Let’s have a closer look.
1. Use Of Social Media Has Increased Tenfold In 10 Years
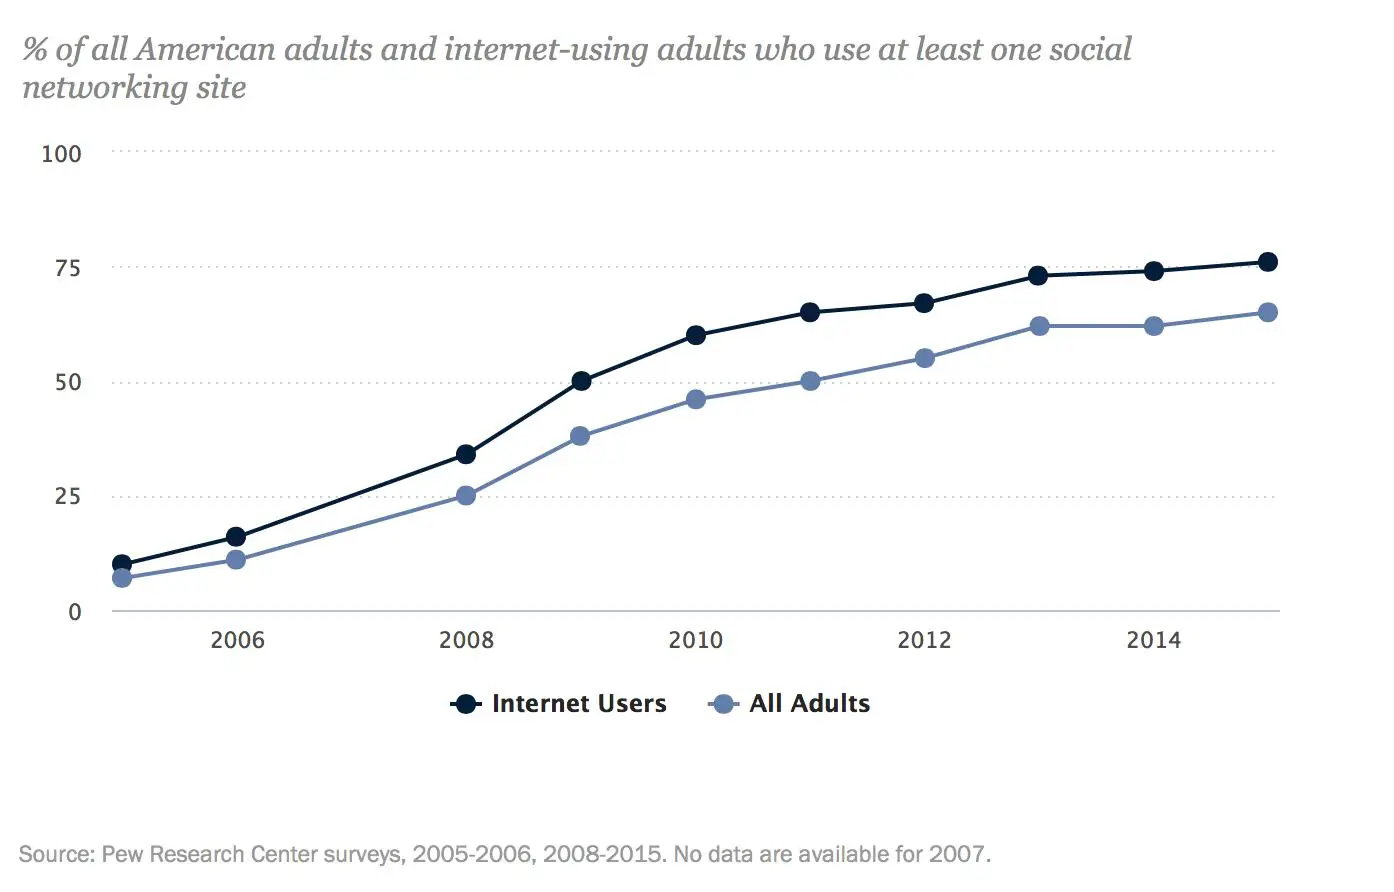
The percentage of American adults who use social media is now 65% – almost 2/3 of all American adults. This is an increase of 58% in ten years, as only 7% used them back in 2005. This is a huge increase. But what else does this increase hide?
If you like our stories, there is an easy way to stay updated:
Follow @wersm
The numbers do not refer only to internet users – a percentage of internet users – but all American adults overall. Within that time there has been particular growth among groups that were not considered early adopters – this leads us to the next insight.
2. Seniors Are A Growing Percentage
Those aged 18 to 29 (young adults) are still the most likely age group to use social media. 90% of them do already. However, groups of older adults (65+) have grown a lot in since 2010. Back then, only 11% used social media. In 2005 only 2% reported using social media. Today it’s 35%
If you like our stories, there is an easy way to stay updated:
Follow @wersm
3. Men And Women Use Social Media Almost Equally
The report found that men and women use social media almost equally – but what has changed in 10 years is that men were more likely to do so in 2005. In 2015, a bigger percentage of women (68%) use social media vs men (62%). These differences are less pronounced in the last few years.
If you like our stories, there is an easy way to stay updated:
Follow @wersm
4. More Educated? More Likely To Use Social Media
Pew Research’s report also found that there are social-economic differences between those who are more and less likely to use social media. Higher-income households and the more educated. As the report explains,
[quote]More than half (56%) of those living in the lowest-income households now use social media, though growth has leveled off in the past few years. Turning to educational attainment, a similar pattern is observed. Those with at least some college experience have been consistently more likely than those with a high school degree or less to use social media over the past decade. 2013 was the first year that more than half of those with a high school diploma or less used social media.[/quote]
5. Balanced Racial Or Ethnic Groups Representation In Social Media Use
There is no evidence that one racial or ethnic group is more likely to use social media more than another. The percentages between ethnic groups are pretty much the same. African-Americans however are less likely, by less than 10%. 65% of whites, 65% of Hispanics and 56% of African-Americans are using social media today.
If you like our stories, there is an easy way to stay updated:
Follow @wersm
6. Social Media Users Are Mainly Urban Or Suburban
Those living in rural areas are less likely to use social media versus those who live in urban or suburban areas. More than half of rural residents now use social media – “Those who live in rural areas are less likely than those in suburban and urban communities to use social media”. This is a pattern which has remained consistent for the past decade.
At this time, roughly “58% of rural residents, 68% of suburban residents, and 64% of urban residents use social media”.
If you like our stories, there is an easy way to stay updated:
Follow @wersm
You can find all the above, plus a lot more of the report, at Pew Research Centre’s site.