Google last week announced a new version of its Crawl Stats report within Google Search Console.
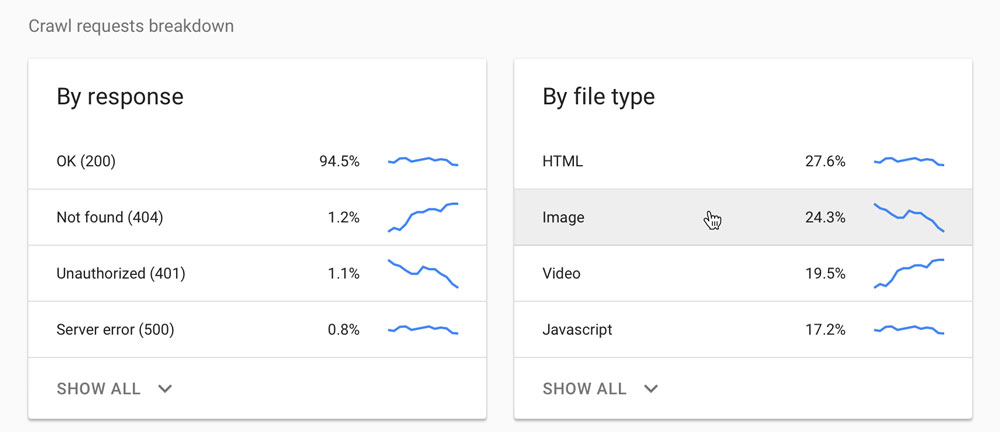
In a bid to help you get a better understanding of how its Googlebot crawls their websites, Google has updated its Crawl Stats report within Google Search Console with several new features. The new version of Crawl Stats now includes the total number of requests grouped by response code, crawled file type, crawl purpose, and Googlebot type and detailed information on host status.
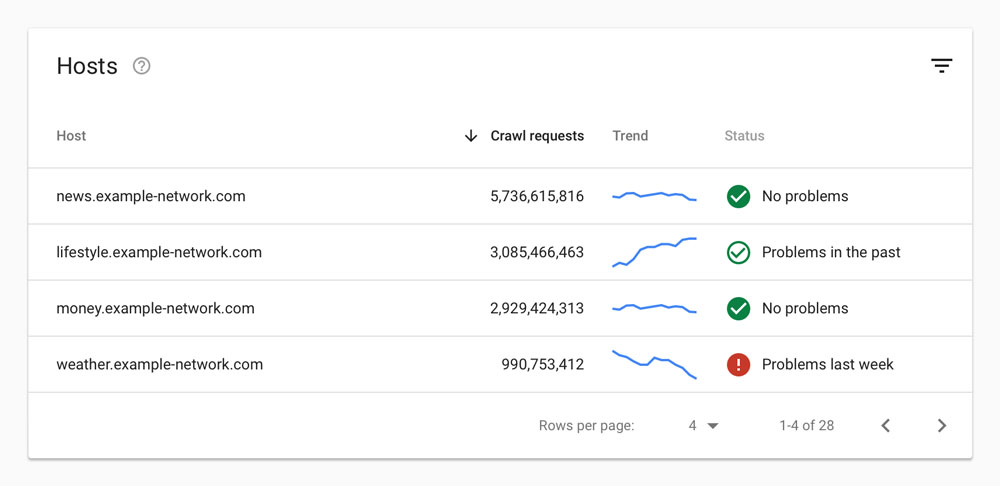
Furthermore, it displays specific URL examples to show where a website’s requests happened, and a summary for properties with multiple hosts and support for domain properties.
Related | Google Is Experimenting With Automatically Turning Web Pages Into Videos
The new Crawl Stats report lets you see Google crawl data totals and overtime charts for total requests, total download size, and average response time. It also shows you grouped crawl data on crawl requests that are now broken down by response, file type, the purpose of the crawl request, and Googlebot agent. You can see example URLs of each type by clicking on a row in the grouping table.

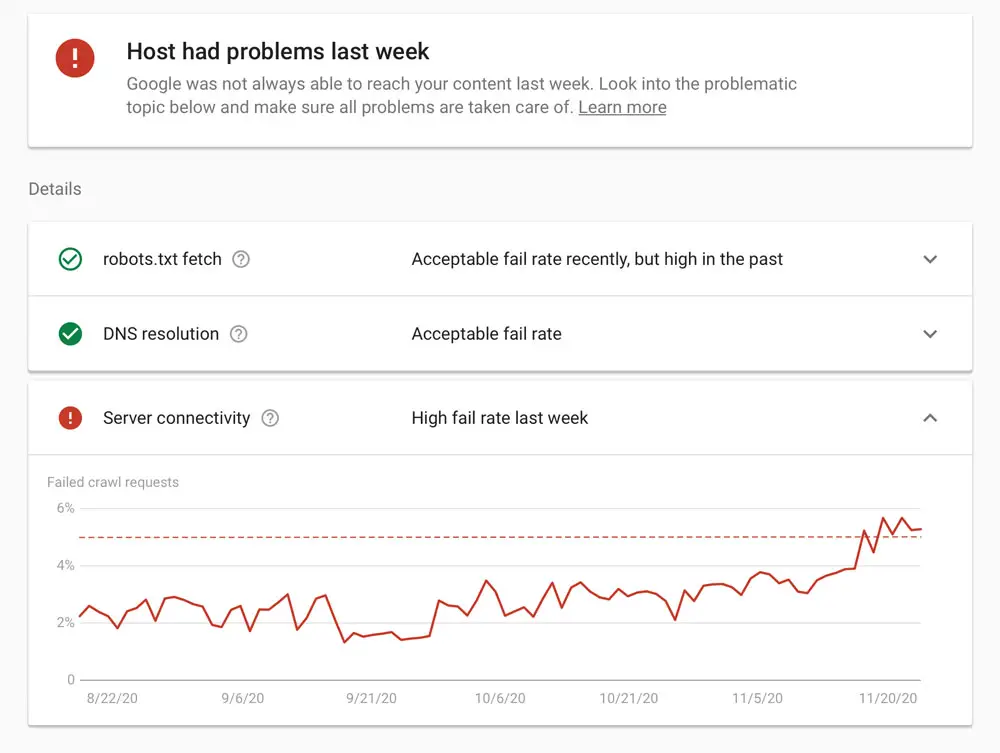
The host status details present within the new report shows high-level and detailed information on host status issues. This lets you monitor your site’s availability to Google within the last 90 days.

Again, you can check the host status for each of the top hosts within the report summary view. This allows you to view the performance of all hosts under your domain – in one place.

The upgrade is handy if you are interested in better understanding how Googlebot has crawled your website historically and over time, what file types and file sizes your website returns, and your site’s availability issues.
This gives you plenty of insight to start fixing problems.
You can check out the Crawl Stats report documentation to determine how to make the data more actionable.
