
Curious to find out the dominant and “most successful” colours of your Instagram account? Year of Colour is a web app that lets you do that, by creating a visual representation of dominant colours in your stream.
Created as a side-project by Stef Lewandowski, a technologist, designer, and venture builder based in London, UK, Year of Colour is a web app that lets you create a palette of colours from your Instagram photos. But that’s not all. You can look back at the most dominant colours present in your Instagram images and use the various sliders to order the colours in various ways. For example, you can order the dots of colour based on popularity, you can filter out dull or vibrant ones, as well as order them by time. Therefore, the series of coloured dots might look random but they are not.
Lewandowski, who helps people build their Instagram presence thought that a tool like this might be able to help people realise what works and what doesn’t: “Maybe there’s a way of using some AI, some machine vision and bit of big data crunching — all those buzzwords — and apply it to something that’s quite human,” he explains. His idea is that by looking at an Instagram account’s dominant colours you might be able to tell a whole lot more.
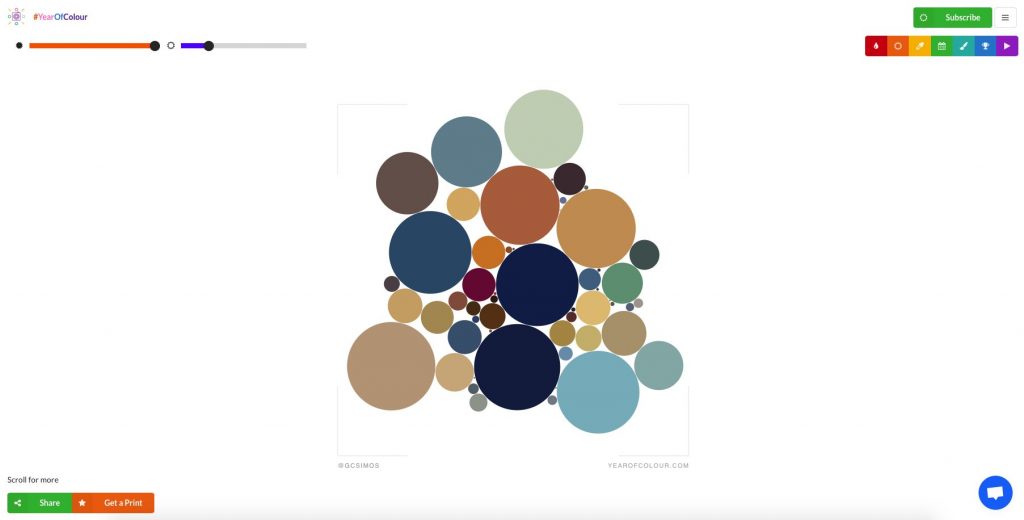
To use the web app, go to yearofcolour.com and log in with your Instagram account. In case you’re wondering, it will only work with your own Instagram accounts, so you can forget about analysing the colours of other very successful accounts. After logging in, you then choose a specific time frame to look at – last year, last month, current year, and a custom time frame – and the app will sort through your most-popular Instagram posts. Then, you will get a data visualization of the colours in your top 100 images as “cloud” of dots.
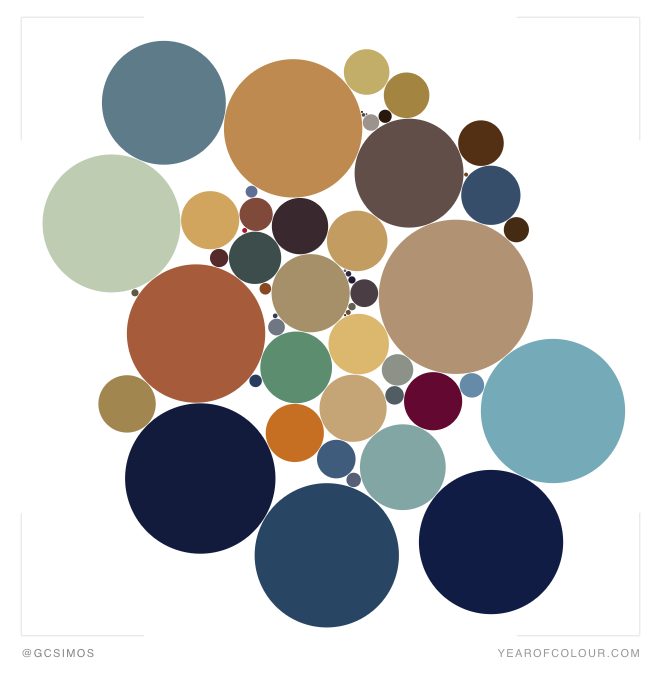
Each image is reduced to a small number of colours (six to nine) and then each of these is placed within the dot pattern. Each dot will have a different size based on how much of each colour appears in images and how popular it is. So, if your most popular post contains lots of green, the app will spit out a big green dot.
As mentioned above, there are also a few ways to change the way colours are visualised. For example, coloured dots can be limited based on popularity, while duller or more vibrant colours can be filtered out. Another button organises colours chronologically, with the earliest in the centre and latest around the edges. If you want to see an animated sequence of how colours changed during your chosen time period, simply press the play button.
Finally, if you really like your resulting visual representation, you can pay $25 to order an A3 print or just $3 to download the file to print it yourself. And by the way, you can also subscribe by paying $3 a month to get a monthly colour report.
[box]Read next: UK Agency ’10 Yetis’ Helps You Find Your Instagram Colour Palette[/box]